Tenant income growing faster than owner income
Press Releases
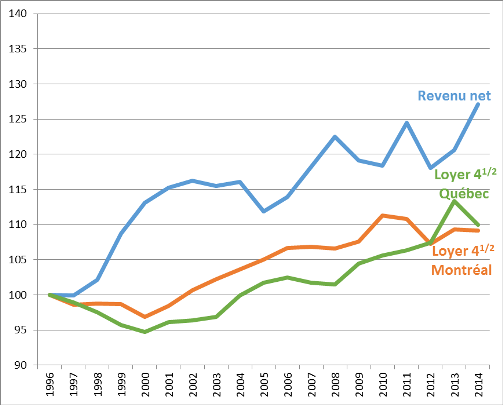
According to the latest data from Statistics Canada,1 the average annual income after taxes of Quebec tenants has risen 27%, on average and in constant dollars, since 1996, going from $29,500 to $37,500. Comparatively, the rent prices observed by the CMHC for a two-bedroom apartment rose only 9% during the same period in the Montréal area and 10% in the Québec area(2).

In 2014, the most recent year for which income data are available, the average rent for a two-bedroom apartment in Quebec was $711 per month ($8,532 per year), or 22.8% of tenants’ annual household budget after taxes. According to the Régie du logement and the CMHC, tenants should not spend more than 30% of their income before taxes on housing, including power.3
Hans Brouillette, Director of Public Affairs at CORPIQ, notes, “The faster-growing income of tenants has reduced, on average, the rent portion of a household’s budget.” What’s surprising about the statistic is that the average household income has increased despite that fact that wealthier tenants moved massively towards purchasing property in recent years and an increasing number of tenants live alone. Tenants’ real income growth is even greater than these statistics imply.
According to CORPIQ, the Quebec government’s control over rent—through the rental board, or the Régie du logement—is excessive and extremely detrimental to the continuity of the rental housing stock. “The relatively slow evolution of rents in Quebec is causing a reduction in internal return rates for rental properties. This affects owners’ financial ability to absorb the maintenance deficit and discourages them to keep their buildings as rental properties. It’s not surprising that many owners or co-owners end up living in the buildings or selling them to people who want to live there,” notes the CORPIQ spokesperson.
Brouillette concludes, “Anti-landlord activist groups are living in another reality with their regressive language. They refuse to acknowledge the numbers from competent authorities and their actions are contributing to the loss of rental units.”
2014 tenant income and rents, in constant dollars
|
Income after tax |
Average rent of a 2-bedroom Montréal area |
Average rent of a |
|
| 1996 | $29,506 | $677 | $705 |
| 1997 | $29,491 | $667 | $697 |
| 1998 | $30,147 | $669 | $687 |
| 1999 | $32,071 | $668 | $674 |
| 2000 | $33,362 | $656 | $667 |
| 2001 | $33,998 | $666 | $677 |
| 2002 | $34,305 | $681 | $679 |
| 2003 | $34,070 | $692 | $683 |
| 2004 | $34,245 | $701 | $704 |
| 2005 | $33,014 | $711 | $717 |
| 2006 | $33,603 | $722 | $722 |
| 2007 | $34,874 | $723 | $716 |
| 2008 | $36,133 | $722 | $715 |
| 2009 | $35,148 | $728 | $736 |
| 2010 | $34,935 | $754 | $744 |
| 2011 | $36,717 | $750 | $749 |
| 2012 | $34,834 | $726 | $757 |
| 2013 | $35,590 | $740 | $768 |
| 2014 | $37,500 | $739 | $775 |
| Total variation | 27 % | 9 % | 10 % |
| Yearly variation | 1,3 % | 0,5 % | 0,5 % |
Average rent for a two-bedroom apartment and tenants’ net annual income, in real dollars (1996=100)

(1) Statistique Canada, Statistique du revenu, EDTR & ECR
(2) Société canadienne d'hypothèques et de logement – Loyers moyens pour les régions de 10 000 habitants et plus, novembre 2016. Convertis en dollars constants par la CORPIQ
(3) Protégez-vous, 2011
– 30 –
 Skip site navigation
